Which Liquid Asset Classes Are the Most Differentiated?

A parsimonious portfolio that focuses on the asset classes that add the most value can help reduce cost and complexity. A machine-learning tool called a dendrogram can group asset classes into a family tree to facilitate this analysis. Selecting asset classes from different families can reduce correlation and potentially create a more efficient portfolio. Based on the analysis below, an argument can be made for a U.S. home bias in both equities and bonds, and for including a variety of alternative investment asset classes and strategies in a portfolio. See Exhibit 4 for this study's conclusion on the most differentiated asset classes.
Defining the Family Tree
While there are many ways to define a family tree, one approach is to focus on relative returns (the difference in returns between asset classes) and correlation (whether the returns are directionally similar). The relationships are bound to change over time, but looking at historical measures can provide a baseline understanding to aid in the asset allocation process.
Including relative returns, and not just correlation, can be beneficial because some asset classes can be differentiated despite a high correlation. For example, over the last 10 years, U.S. equities outperformed international equities by a large margin (see Exhibit 1 below) while exhibiting a high correlation coefficient of over 0.85 (with 1 representing perfect correlation and 0 representing no correlation at all). U.S. bonds and international bonds were also highly correlated during that time period but had more similar returns. The asset classes in Exhibit 1 and throughout this study are represented by the ETFs and mutual funds listed in Exhibit 5 in the appendix.
Exhibit 1: U.S. vs. International Equities and Bonds
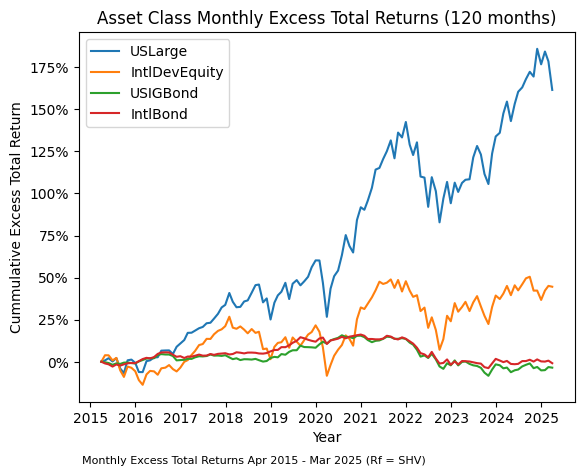
A U.S. investor could have therefore utilized lower-cost funds and reduced currency risk by forgoing international bonds altogether. Could the same be said about international developed equities? In this example, international equities were seemingly differentiated enough from U.S. equities to potentially add diversification value in a portfolio. Note that this family tree analysis does not evaluate whether the underperformance of international equities will persist; only if the performance was sufficiently different.
Drawing the Family Tree
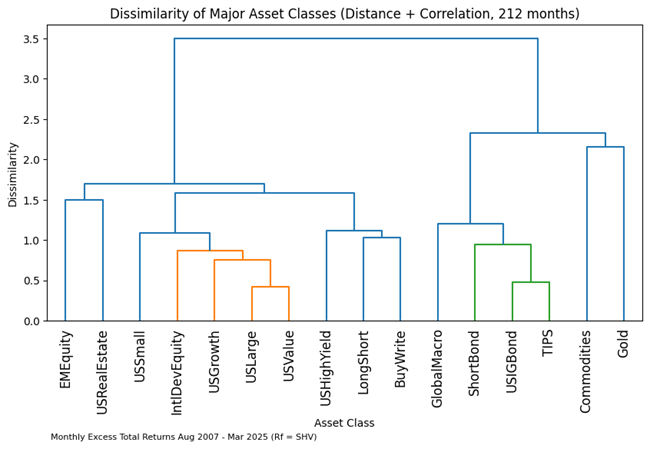
A machine-learning tool called a dendrogram can take a customized calculation for the level of differentiation in relative returns (called "Euclidean distance") and correlation to draw a family a tree like the one below in Exhibit 2. This particular tree uses monthly excess returns from 2007 to 2025. The height of the horizontal lines measures on the y-axis how dissimilar the asset classes are from each other. For this analysis, a measure of 1.0 was the selected threshold to indicate sufficient differentiation, although the number itself does not carry an intuitive meaning.
The asset classes or groups of asset classes connected by blue lines are differentiated while the asset classes connected by other colors, such as orange or green, are closely related. For example, U.S. growth, U.S. value, U.S. large cap, and international developed equities are not sufficiently dissimilar and are thus connected by orange lines. However, U.S. small cap equities are sufficiently dissimilar and thus connected by a blue line. At the highest level, the asset classes are generally divided into two groups: equities on the left, and bonds and some real assets (commodities and gold) on the right. Note that high yield bonds are more closely related to equities than to other bonds in this family tree.
Exhibit 2: Family Tree of Major Asset Classes 2007-2025
Adding More Asset Classes
Exhibit 3 below shortens the timeframe but adds many more asset classes. The dissimilarity of bitcoin (in blue on the far left) is literally off the chart, in part because of its extraordinary volatility. Commodities (in blue right of center) also stand out.
Exhibit 3: Family Tree with More Asset Classes 2017-2025
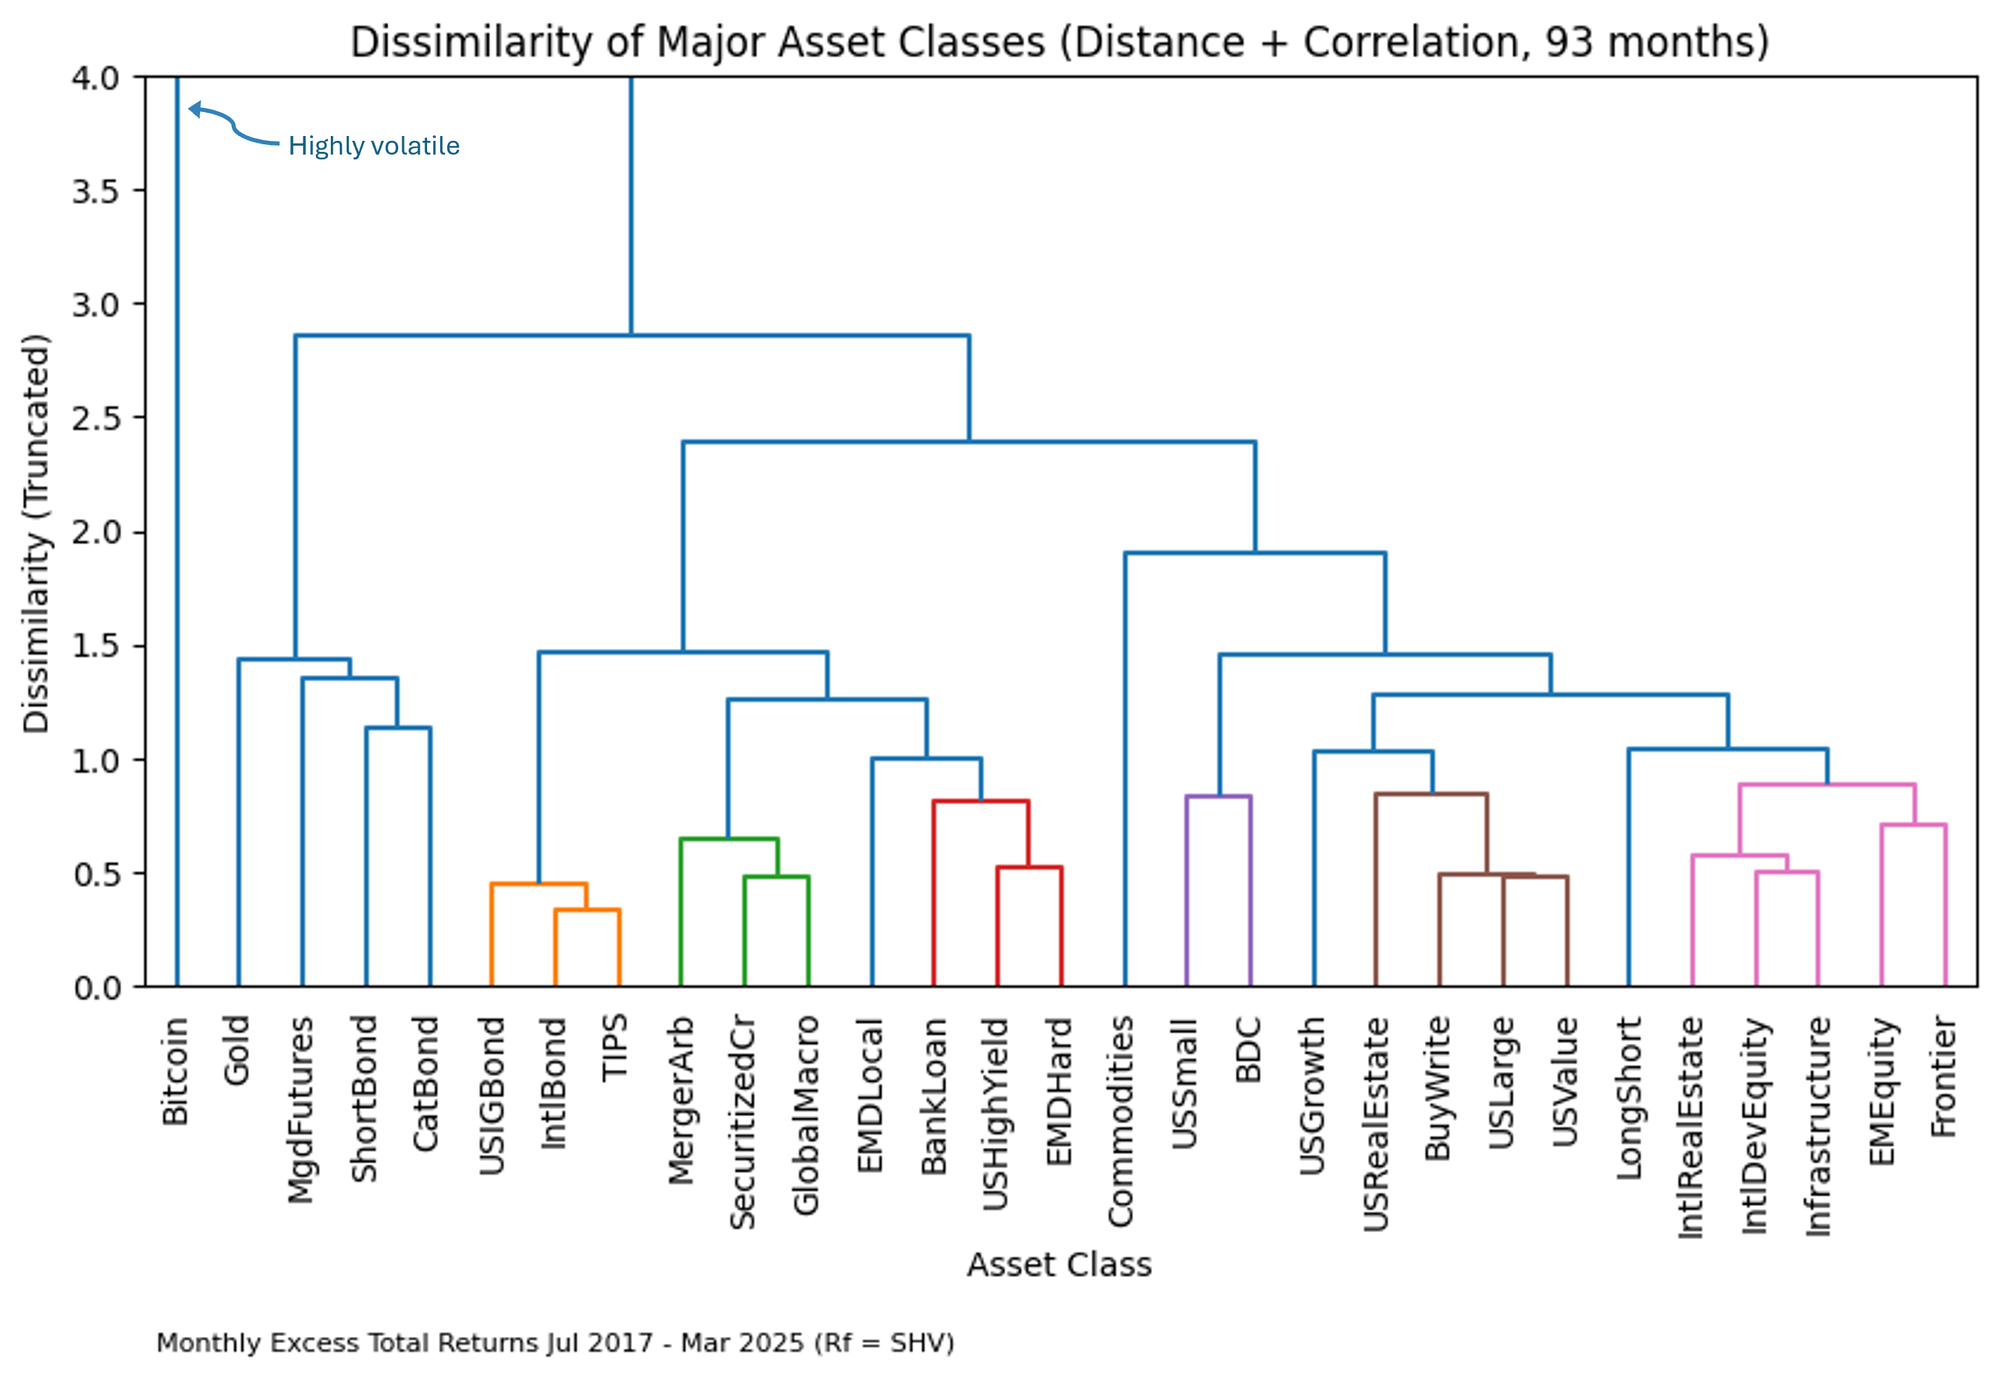
The groupings in Exhibit 3 above are not as homogeneous as those in Exhibit 2 in the prior section. For example, gold (a type of real asset), managed futures (a type of alternative strategy), short-term bonds (a common fixed income asset) and catastrophe bonds (a type of alternative income asset) all show up in one group.
For simplicity, this study uses the term "asset class" to refer to what are actually investment strategies, such as managed futures and merger arbitrage. These strategies apply shorting and other techniques on asset classes like equities, bonds and commodities. Additionally, in investment industry jargon, anything that is not a traded stock, bond or commodity is sometimes referred to as "alternative" even if it has become quite mainstream.
This study also included analysis for trailing 10 years and 15 years, although the family trees are not shown. The relationships were generally, but not absolutely, consistent across timeframes. An extension of this study could include rolling periods or a scenario comparison.
Selecting the Differentiated Asset Classes
After evaluating family trees across multiple timeframes and weighing the observations against other types of analysis, an investor can form some conclusions. For example, in this analysis international bonds were not differentiated from U.S. investment grade bonds. A U.S. investor could therefore eschew international bonds and just buy a U.S. bond ETF like AGG, which has lower fees, can be traded more efficiently, and has lower currency risk as compared to an international bond fund.
While a similar argument can be made for shunning international developed equities, there are other factors to consider. International developed equities were differentiated from U.S. large cap equities in some timeframes, play an important role in global equity markets, and may be attractively valued at times. A U.S. investor could instead have a strategic home bias to potentially reduce fees and currency risk, but still have exposure to international developed equities. Moreover, the reduction in fees and certain risks could create room in cost and risk budgets to have an increased allocation to emerging market equities, which were differentiated across multiple timeframes.
As another example, a U.S. investor could have a strategic focus on U.S. high yield bonds but tactically allocate to bank loans and emerging market bonds as opportunities arise. Alternatively, the investor could reduce complexity by hiring a manager that focuses on U.S. high yield bonds and tactically allocates to the other income asset classes, instead of hiring three different managers. Multi-manager and multi-asset funds can also reduce the number of funds required.
As a final example, an investor could allocate to a global macro manager and not a separate merger arbitrage manager (a global macro strategy could already include merger arbitrage).
Conclusions
Exhibit 4 below summarizes this study's conclusions on the most differentiated asset classes if more weight is placed on longer timeframes and more accessible asset classes. Investors may arrive at distinct conclusions, especially if they have active management skills or can hire skilled active managers. Please see the appendix for some additional important caveats.
| Exhibit 4: Most Differentiated Asset Classes | |
|---|---|
| Category | Asset Class |
| Equity | U.S. Large U.S. Small Emerging Market Equity |
| Fixed Income | U.S. Investment Grade U.S. High Yield |
| Real Assets | Commodities Gold U.S. Real Estate |
| Other Diversifiers | Bitcoin Buy/Write Global Macro Long/Short Equity Managed Futures |
Based on a family tree analysis of liquid asset classes across multiple time periods that groups similar asset classes, an argument can be made for a U.S. home bias in both equities and bonds, and for including a variety of alternative investment asset classes and strategies in a portfolio. Selecting asset classes from different groups or families can potentially help create a more efficient portfolio. This type of analysis could also be applied to other features, such as sectors or regions.
Appendix: Asset Classes and Proxy Funds
Exhibit 5 below lists the proxy funds that were used to represent the asset classes. When selecting the proxy funds, this study generally favored a longer track record (to 2007, which is the earliest date available for the risk-free cash proxy), passive strategies, groups of indices (e.g. Russell for both U.S. large cap and small cap), and cheaper strategies. All funds are liquid ETFs or mutual funds. Most are passive except for the proxies for securitized credit, global macro, long/short equity and catastrophe bond. The active funds will therefore have a survivorship bias and potentially manager alpha.
There is a securitized credit index, but it is heavy on agency MBS, which is already covered in the ETF ticker AGG. This study therefore selected an active fund that has limited exposure to agency MBS. There are indices or peer medians available for global macro, long/short equity and catastrophe bond, but those were not available in the data feed used for this study.
| Exhibit 5: List of ETFs and Mutual Funds Used to Represent Asset Classes | ||||
|---|---|---|---|---|
| Ticker | FundName | AssetClass | EarliestDate | Category |
| IWB | iShares Russell 1000 ETF | USLarge | 5/19/2000 | Equity |
| IWM | iShares Russell 2000 ETF | USSmall | 5/26/2000 | Equity |
| IWF | iShares Russell 1000 Growth ETF | USGrowth | 5/26/2000 | Equity |
| IWD | iShares Russell 1000 Value ETF | USValue | 5/26/2000 | Equity |
| VEA | Vanguard FTSE Developed Markets ETF | IntlDevEquity | 7/26/2007 | Equity |
| VWO | Vanguard FTSE Emerging Markets ETF | EMEquity | 3/10/2005 | Equity |
| HLMOX | Harding Loevner Frontier Emerg Mkts Inv | Frontier | 12/31/2010 | Equity |
| AGG | iShares Core U.S. Aggregate Bond ETF | USIGBond | 9/26/2003 | FixedIncome |
| HYG | iShares iBoxx High Yield Corporate Bond ETF | USHighYield | 4/11/2007 | FixedIncome |
| BKLN | Invesco Senior Loan ETF | BankLoan | 3/3/2011 | FixedIncome |
| BIZD | VanEck BDC Income ETF | BDC | 2/12/2013 | FixedIncome |
| BNDX | Vanguard Total International Bond ETF | IntlBond | 6/4/2013 | FixedIncome |
| EMB | iShares JP Morgan USD Em Mkts Bd ETF | EMDHard | 12/19/2007 | FixedIncome |
| LEMB | iShares JP Morgan EM Local Ccy Bd ETF | EMDLocal | 10/20/2011 | FixedIncome |
| TIP | iShares TIPS Bond ETF | TIPS | 12/5/2003 | FixedIncome |
| VCFIX | Voya Securitized Credit I | SecuritizedCr | 8/5/2015 | FixedIncome |
| SHY | iShares 1-3 Year Treasury Bond ETF | ShortBond | 7/26/2002 | FixedIncome |
| SHV | iShares Short Treasury Bond ETF | Cash | 1/11/2007 | FixedIncome |
| VNQ | Vanguard Real Estate ETF | USRealEstate | 9/29/2004 | RealAsset |
| VNQI | Vanguard Global ex-US Real Est ETF | IntlRealEstate | 11/1/2010 | RealAsset |
| IGF | iShares Global Infrastructure ETF | Infrastructure | 12/12/2007 | RealAsset |
| DBC | Invesco DB Commodity Tracking | Commodities | 2/6/2006 | RealAsset |
| GLD | SPDR Gold Shares | Gold | 11/18/2004 | RealAsset |
| EIGMX | Eaton Vance Glbl Macr Absolute Return I | GlobalMacro | 6/27/2007 | Diversifier |
| BPLSX | Boston Partners Long/Short Equity Instl | LongShort | 11/16/1998 | Diversifier |
| RYMFX | Guggenheim Managed Futures Strategy P | MgdFutures | 1/2/2008 | Diversifier |
| BXMX | Nuveen S&P 500 Buy-Write Income | BuyWrite | 10/27/2004 | Diversifier |
| MNA | NYLI Merger Arbitrage ETF | MergerArb | 11/17/2009 | Diversifier |
| SHRIX | Stone Ridge Hi Yld Reinsurance Risk PrmI | CatBond | 6/12/2017 | Diversifier |
| BTCUSD | BTC/USD | Bitcoin | 9/30/2011 | Diversifier |